Skip to main content







How we build a price outlook: This analysis combines technical and fundamental inputs. Technical: historical price behaviour, the recent trading range, relative performance and momentum. Fundamental: token supply, the mechanisms that convert network usage into token demand, fee and revenue data, and ecosystem developments. Outputs are conditional scenarios with the assumptions stated, not a single number. Third-party figures are named and dated.
The question worth asking in any LINK price prediction 2026 is not whether Chainlink is being adopted. That is settled and the announcements arrive weekly. The question is whether network usage actually creates demand for the token, because those are separate things and most infrastructure tokens fail at the second one. Chainlink has built a mechanism specifically to close that gap. Here is what it moves, measured on 3 September 2026.
Key Takeaways
- LINK traded at $11.04 with a market capitalisation of $8.26 billion at rank 18 on 3 September 2026.
- The token is up 35.7% over thirty days and 52.8% over twelve months, so the older “still consolidating” framing is out of date.
- CoinGecko records $844.30 in on-chain fees over 24 hours, which annualises to roughly $308,000.
- The Chainlink Reserve has been buying LINK at a reported pace near $72 million a year, about 0.87% of market cap.
- Those two revenue figures differ by more than 200 times, and that gap is the heart of any LINK price prediction 2026.
LINK price prediction 2026: where the token actually trades
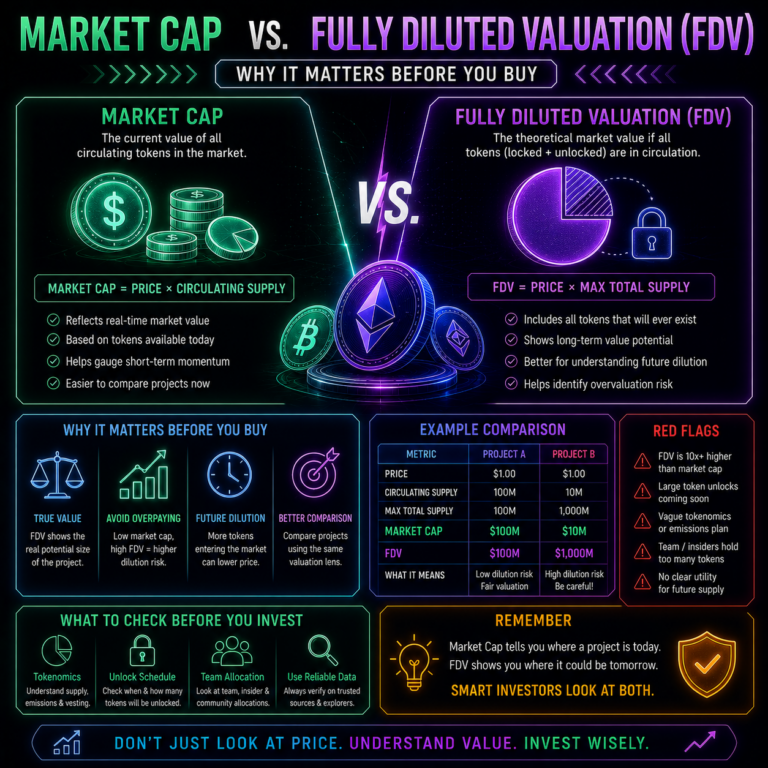
CoinGecko put LINK at $11.04 on 3 September 2026, down 1.1% on the day and 3.6% over the week, with 24-hour volume of $317.7 million across 407 markets. Market capitalisation was $8,261,036,367 at rank 18, against a fully diluted valuation of $11.05 billion, giving a market cap to FDV ratio of 0.75.
The performance figures matter more than the level. LINK is up 35.7% over thirty days and 52.8% over twelve months. It has traded between $10.92 and $12.05 over the past week. Against its all-time high of $52.70 from 9 May 2021 it sits about 79% below, so regaining that peak needs roughly a 4.8 times move.
That combination is unusual and it undercuts the framing this page previously carried. A token up 52.8% on the year is not an asset waiting for a trend to begin. It is one already in a trend, trading in the upper part of its recent range.
The two revenue numbers, and why they disagree
This is the part that makes a LINK price prediction 2026 harder than it looks, and almost nobody separates the two figures.
CoinGecko’s financial data, sourced from Token Terminal, records Chainlink taking $844.30 in fees over 24 hours, with project revenue at the same figure. Annualise that and you get roughly $308,000 against an $8.26 billion market cap, a ratio of nearly 27,000 times. Taken alone it looks absurd.
Separately, the Chainlink Reserve converts service revenue into LINK purchases and publishes the amounts. Reporting in August 2026 put the July addition at roughly 707,000 LINK, taking Reserve holdings to about 5.21 million, with a further repurchase of around 127,740 LINK reported later in the month. At July’s pace, that buying works out near $72 million a year, or about 0.87% of the current market cap.
Those two figures differ by more than two hundred times. The reason is that the on-chain fee metric captures only what settles on public ledgers, while Chainlink’s revenue includes enterprise and off-chain service agreements that never touch a block explorer. Neither number is wrong. Quoting either one alone is misleading, which is why coverage of this token varies so wildly.
What the demand mechanism actually does
Two things remove LINK from circulation, and both matter to a LINK price prediction 2026 while being modest against the size of the token.
The Reserve buys with revenue, at a pace equal to roughly 0.87% of market capitalisation annually on current reporting. Staking locks tokens as node operator collateral, and reporting puts staked LINK near 45 million, around 6% of the 750 million circulating.
Set against that, 250 million LINK of the 1 billion maximum has still to enter circulation, which is the counterweight the bullish version of this story usually omits. Our coverage of tokenized real-world assets covers the demand side that would need to grow for the mechanism to matter more.
The adoption running underneath
The integrations are genuine and recent, which is worth stating plainly because the old version of this page asserted them without a single example.
In the first days of September 2026, Wyoming expanded its Chainlink partnership to include on-chain reserve verification for its state-issued FRNT stable token, reported by The Block and Cointelegraph on 2 September. The US Department of Commerce began using Chainlink to publish macroeconomic data across ten blockchains. Chainlink was named in a Bank for International Settlements proof of concept for data anchoring, and Charles Schwab is reported to be adding LINK to its crypto platform.
CoinGecko’s own profile lists institutional counterparties including Swift, Mastercard, Euroclear, UBS, ANZ, Fidelity International and J.P. Morgan. Total value secured across the network shows as $1.727 billion in TVL terms, giving a market cap to TVL ratio of 4.78.
LINK price prediction 2026: the scenario framework
Bearish case. LINK loses the $10.92 weekly low and gives back part of the thirty-day advance. Conditions: broad altcoin weakness, the recent 11.7% drop in daily volume persisting, and the Reserve’s buying staying too small to matter at under 1% of market cap.
Base case. LINK holds between roughly $10.50 and $12.50, consolidating the recent move while institutional integrations continue arriving without yet showing in fee revenue. This is where the current evidence sits.
Bullish case. A sustained break above the $12.05 weekly high on rising volume would extend the trend. For anything larger, the Reserve’s buying rate would need to grow materially, since 0.87% of market cap a year is a floor rather than a driver.
What would change this view
Three things would change this LINK price prediction 2026, and all are checkable monthly.
The Reserve’s accumulation rate rising. It publishes monthly, so this is the cleanest available signal of usage converting to token demand.
On-chain fee revenue growing from its current base. At roughly $308,000 annualised, there is a great deal of room, and growth there would mean value settling on-chain rather than in private agreements.
Volume rising alongside price. The last 24 hours showed volume down 11.7% while price fell 1.1%, which is the weaker configuration. Our coverage of crypto volatility and ETF inflows covers the wider flow backdrop.
Final Thoughts
The measured version of a LINK price prediction 2026 is that Chainlink has done something most infrastructure projects have not, which is build an explicit route from revenue to token demand and publish the receipts. It is working. It is also small, at under 1% of market cap a year, and the token still trades 79% below its 2021 peak despite being up 52.8% over twelve months.
Treat $10.50 to $12.50 as the working range, watch the Reserve’s monthly figure rather than the integration announcements, and remember that the two revenue numbers published for this network differ by more than two hundred times. Knowing which one someone is quoting tells you most of what you need about their argument.
Disclaimer: This article is for informational and educational purposes only and is not financial or investment advice. No scenario here is a forecast of what will happen and no outcome is assured. Cryptocurrency prices are volatile and you may lose money. Reserve and staking figures are drawn from published reporting and every number carries the date it was read. Do your own research and consider speaking to a qualified professional before making investment decisions. See our editorial policy for how we source and verify our reporting.
Data Sources
- CoinGecko, Chainlink (LINK) price, supply, tokenomics and financial data, read 3 September 2026
- CoinGecko, Global Cryptocurrency Market Cap Charts, checked 3 September 2026
- The Block, Wyoming expands Chainlink partnership for on-chain reserve verification of FRNT, 2 September 2026
- Cointelegraph, Wyoming adds Chainlink reserve verification to state-issued stable token, 2 September 2026