 Skip to main content







NFTs in 2026: Dead, Niche, or Quietly Rebuilding?
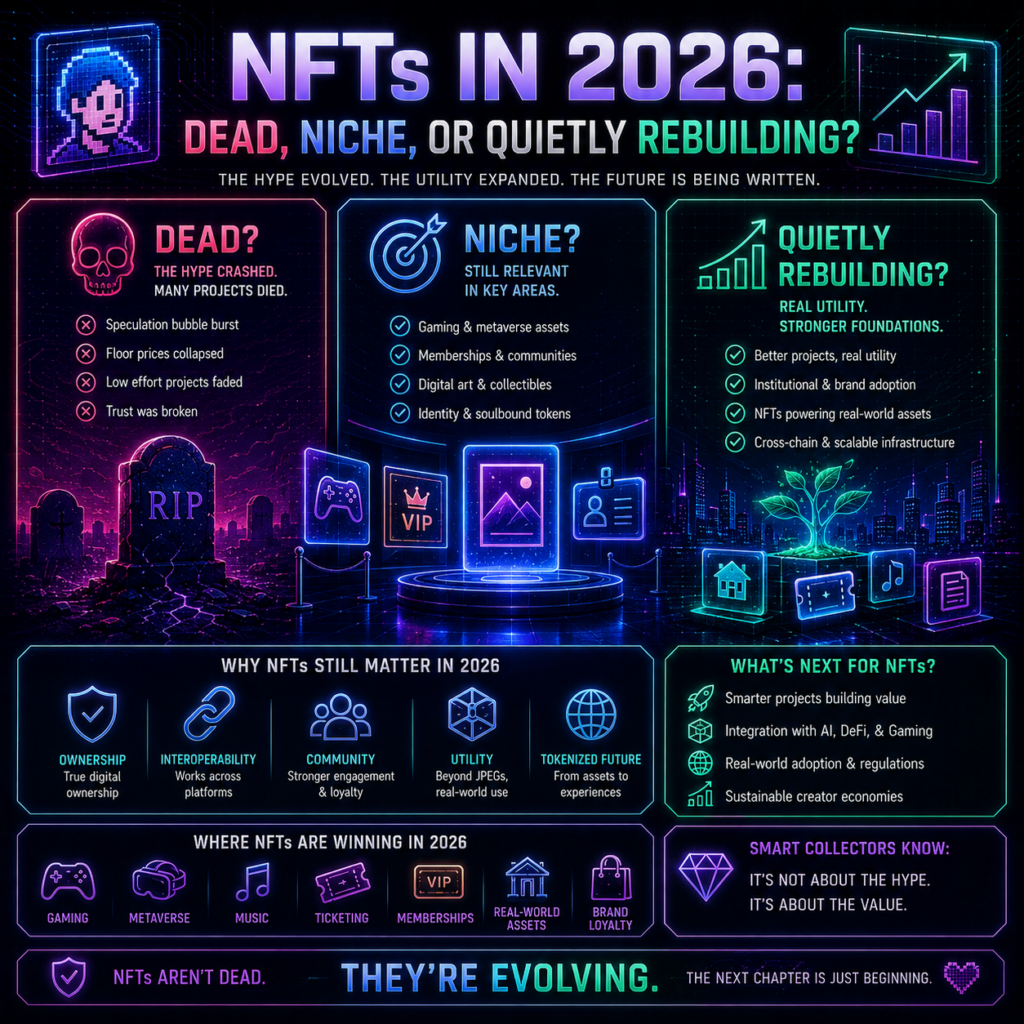
Ask about the NFT market 2026 and you get two confident answers, both wrong. One says NFTs died in 2022 and anything since is a corpse twitching. The other says a comeback is underway and points at rising sales counts. The data supports neither cleanly, and the gap between those two readings is the genuinely interesting part. Sales volumes are up sharply. Dollar volumes are a fraction of the peak. Both facts are true at once, and understanding why tells you what NFTs have actually become. Key Takeaways DappRadar recorded 18.1 million NFT sales in Q3 2025, the highest quarterly count since 2022, generating $1.58 billion in volume. For comparison, DappRadar reported $12.46 billion in Q1 2022 alone, so dollar volume sits at roughly an eighth of the peak. Sales rose 158% between Q1 and Q3 2025 while trading wallets rose only 28.6%, meaning existing users trading more, not new users arriving. The NFT market capitalisation was around $1.7 billion in March 2026, against a 2022 high above $17 billion per CoinGecko. Growth in the NFT market 2026 is concentrated in sports, tokenized physical collectibles and profile pictures rather than art. The NFT market 2026 numbers, honestly Start with the strongest case for recovery. DappRadar’s Q3 2025 industry report recorded over 18.1 million NFTs sold in the quarter, up from 7 million in Q1 and 12.5 million in Q2. Trading volume almost doubled over the quarter to $1.58 billion. NFTs took second place by dapp category dominance at 18.5%, ahead of DeFi. Now the comparison that keeps it honest. DappRadar data reported in December 2022 put Q1 2022 trading volume at $12.46 billion, falling to $8.4 billion in Q2 and $4.4 billion across the second half. Against $12.46 billion in a single quarter, $1.58 billion is roughly an eighth. On market capitalisation the gap is similar: DL News reported in March 2026, citing CoinGecko, that the NFT market sat around $1.7 billion against a 2022 high above $17 billion. So the volume collapse is real and has not reversed. What changed is that far more things are being bought, at far lower prices. The detail that complicates the recovery story DappRadar itself flags the caveat, which is why its report is worth reading rather than the headlines about it. Between Q1 and Q3 2025, sales rose 158% while the number of wallets trading NFTs rose from 1.66 million to 2.14 million, an increase of only 28.6%. Average NFTs per wallet went from 4.2 to 8.4. DappRadar’s own reading is that this suggests conviction from established participants rather than an influx of new users. That is a meaningfully different thing from a comeback. There is a second caveat. Part of the surge came from OpenSea’s campaign ahead of its planned token, which rewarded active traders and led users to trade low-value NFTs to meet daily criteria. OpenSea’s sales count rose 29% to 9.27 million on the back of it. That token was later postponed indefinitely, which means a slice of the recovery in the NFT market 2026 inherited was farming activity chasing a reward that has not arrived. What is actually growing Strip out the noise and the growth is specific rather than general, which is the most useful finding in the data. Sports NFTs grew trading volume 337% to $71.1 million in Q3 2025, with sales up 143% to 4.1 million, driven largely by Sorare’s fantasy football, basketball and baseball cards tied to new season launches. Profile picture collections grew 187% to $544 million, led by CryptoPunks, Moonbirds, BAYC and Pudgy Penguins. The most interesting entry is Courtyard, which DappRadar listed as the leading NFT collection. Courtyard tokenizes physical trading cards, Pokémon and baseball among them, so each NFT is a claim on a real card that holders can redeem. It did more than $145 million in volume across 1.55 million items in Q3 2025 alone. That is not speculation on a JPEG. It is a settlement layer for a collectibles market that already existed. Our coverage of tokenized real-world assets covers the wider version of that idea. Gaming, the category that was supposed to carry NFTs into the mainstream, went the other way: volume down 17% and sales count down 32% over the same quarter. So which is it? Niche and rebuilding, on the evidence, though the NFT market 2026 is not rebuilding in the way the 2021 crowd expected. Dead is wrong. A market doing 18 million quarterly sales with two million active wallets and a real tokenized-collectibles business is not dead. Booming is also wrong: dollar volume is down roughly 87% from the peak, wallet growth is modest, and some of the activity was incentivised by a token that never launched. What fits is a market that has stopped being an asset class and started being infrastructure. The winners are tied to something outside themselves, whether a physical card, a sports season, or a brand. The losers are the ones whose value rested purely on the next buyer, which is the same pattern we describe in our piece on meme coins versus utility coins. Disclaimer: This article is for informational and educational purposes only and is not financial or investment advice, and no collection, platform or asset is endorsed. NFTs are illiquid, highly volatile and can become worthless. Market data changes constantly and figures are stated with their source and date. Do your own research and consider speaking to a qualified professional. See our editorial policy for how we source and verify our reporting. Final Thoughts The most honest summary of the NFT market 2026 has produced is that the speculative layer left and the useful layer stayed. That is a smaller business than 2021 promised, and a more durable one than 2022 suggested. Anyone quoting a single figure to prove NFTs are back or finished is choosing which number serves the argument. Sales counts say recovery, dollar volumes say collapse, wallet growth says stagnation, and the category breakdown says the market is reorganising around things with an anchor outside the token. All four are
What Happens When a Crypto Exchange Gets Hacked? Lessons From Bybit’s $1.5B Breach

By Adrian, [TITLE FROM SITE BIO] – Last updated August 2026 The most useful thing about the Bybit hack explained properly is that it was not a hack of Bybit. No key was stolen, no server was breached, and the cold wallet worked exactly as designed. What failed was the screen the signers were looking at. Understanding that distinction matters more than the headline number, because it changes what you should conclude about where to hold funds. Here is the documented mechanism, the recovery position as of 2026, and what it does and does not imply for ordinary holders. Key Takeaways On 21 February 2025, roughly 401,000 ETH left a Bybit cold wallet, valued at about $1.46 billion by Elliptic and nearly $1.5 billion by Chainalysis. The attackers compromised a Safe developer’s machine and inserted malicious JavaScript into the wallet interface Bybit’s signers used. Any Bybit hack explained accurately starts here: the signers approved what looked like a routine transfer, but the underlying instruction was different. Elliptic and Chainalysis both attributed the theft to North Korea, an assessment later confirmed by the FBI. By February 2026 Elliptic reported the vast majority of the stolen funds had been processed through laundering channels. The Bybit hack explained: what actually happened Chainalysis published a step-by-step account on 24 February 2025, updated three days later. The sequence has five stages. First, the compromise. The attackers gained access to a Safe developer’s computer and used it to control the Safe user interface specifically serving Bybit’s transactions, adding a malicious JavaScript snippet to the frontend so a malicious transaction would display as a legitimate one. Second, the transfer. During what appeared to be a routine movement from Bybit’s Ethereum cold wallet to a hot wallet, the signers approved the transaction they could see. The instruction they actually authorised handed control to the attackers, who moved roughly 401,000 ETH to their own addresses. Third, dispersion through a web of intermediary addresses. Fourth, conversion: significant portions were swapped into BTC and DAI using decentralised exchanges, cross-chain bridges and a no-KYC instant swap service. Fifth, patience. Chainalysis noted a deliberate choice to leave a notable portion dormant, outlasting the scrutiny that follows a high-profile breach. NCC Group’s technical analysis records the precise figure as 401,347 ETH and notes Bybit’s setup required at least three signers. Multiple signatures did not help, because every signer was shown the same falsified screen. Why the cold wallet did not protect anything This is the part worth internalising. Cold storage protects a private key from being extracted remotely. It does nothing about a validly signed transaction, because from the blockchain’s perspective a signature obtained by deception is indistinguishable from one given willingly. The attack surface was the interface between the human and the key. Bybit did not use a compromised exchange. It used a compromised view of what it was approving, and the security model collapsed at exactly the point where a person reads a screen and decides. Any Bybit hack explained without that emphasis misses why it happened. Attribution and what followed Elliptic attributed the theft to North Korea within days, based partly on laundering patterns, an assessment the FBI later confirmed. Chainalysis reached the same conclusion independently, noting that funds from the exploit consolidated in addresses already holding proceeds from other DPRK-linked attacks. Two named firms working from separate evidence is what makes this attribution unusually solid. Recovery was partial. Chainalysis reported helping freeze more than $40 million in the immediate aftermath, and Bybit launched a bounty offering up to 10% of recovered amounts. Against $1.46 billion, that is a small fraction. The longer arc is documented in Elliptic’s twelve-month review, published 16 February 2026. Over $1 billion had been laundered within six months, much of it through suspected Chinese over-the-counter services, and by the first anniversary the vast majority of the stolen funds had been processed. Roughly $200 million, close to 15%, went through eXch, a no-KYC service that refused Bybit’s requests to block the activity and shut down on 1 May 2025. What it means for where you hold funds The tempting conclusion from any Bybit hack explained is that exchanges are unsafe and self-custody is the answer. That is too simple, and the evidence points somewhere more specific. Bybit covered customer losses and continued operating, so users did not lose money. The failure was in an institutional signing workflow, not in the exchange’s obligation to its customers. Meanwhile the same class of attack, showing a signer something other than what they are approving, works identically against an individual using a hardware wallet with a compromised front end. Owning your keys does not remove this risk. It transfers it to you. What actually reduces it is narrower: verify transaction details on a device screen rather than a browser, treat wallet interfaces as attack surface, and split holdings so a single compromised approval cannot take everything. Our overview of the exchanges defining the industry and our piece on centralization versus decentralization cover the trade-offs. Disclaimer: This article is for informational and educational purposes only and is not financial, investment or security advice. Crypto assets carry risk including total loss, and no custody arrangement removes that risk. Details of this incident are drawn from published analyses by named firms and may be updated as investigations continue. Do your own research and consider speaking to a qualified professional. See our editorial policy for how we source and verify our reporting. Final Thoughts The Bybit incident remains the largest confirmed crypto theft on record, and the reason it happened is more mundane than its scale suggests. Sophisticated attackers did not break cryptography. They changed what a handful of people saw on a webpage and waited for the approvals. That should shift how the industry talks about security. Key storage is a solved problem in the sense that hardware and multi-signature setups work when used correctly. Transaction verification is not solved, because it still depends on a human reading an accurate representation of what
Bitcoin Slips to $64K After Fed’s Hawkish 9-3 Hold Vote

The Bitcoin price slipped to $63,929 on July 29, 2026, after the Federal Reserve held the federal funds rate at 3.50%-3.75% by a rare 9-3 vote — the most divided Fed decision in years. Governors Beth Hammack, Neel Kashkari, and Lorie Logan all dissented in favor of an immediate rate hike, giving Chair Kevin Warsh’s second FOMC meeting a distinctly hawkish tilt even though the headline outcome matched consensus. Markets responded with broad risk-off: the S&P 500 fell 0.6%, Nasdaq -0.5%, Dow -840 points, and 30-year Treasury yields jumped 9 basis points to 5.193%. This is the fifth consecutive Fed hold under Warsh’s leadership. The honest setup: this is a “hawkish hold” — the policy path stayed the same, but the vote composition tells a different story about what happens next. Three dissenting hawks on a 12-member committee is the loudest internal signal in years that further tightening remains on the table. The Bitcoin price weakness reflects that reality. By contrast, spot Bitcoin ETFs saw a $225 million outflow on July 23 that broke a seven-session $999M inflow streak — 2026 net ETF flows now sit approximately $4.5 billion in the red following June’s record $4.5B outflow month. The macro backdrop matters more for the Bitcoin price than any single technical level right now. The 9-3 Hawkish Hold: What Actually Happened The July 28-29 FOMC concluded with the federal funds rate unchanged at 3.50%-3.75% for a fifth consecutive meeting. Warsh’s statement ran 130 words — matching June’s terse length and reflecting his stated preference for less forward guidance. Per CNBC coverage, “keeping with Warsh’s first meeting, the statement was much shorter than what had become the norm.” The vote composition told the real story. Three FOMC members — Beth Hammack, Neel Kashkari, and Lorie Logan — dissented in favor of an immediate rate hike, making it the most divided Fed decision in years. Per CryptoTimes coverage: “The rare three-member dissent gives the decision a more hawkish tone, shifting attention to Chair Kevin Warsh and any signals on inflation or the possibility of future rate hikes.” Warsh’s July 14 Congressional testimony reinforced the hawkish orientation: he stated the Fed has “no tolerance for persistently elevated inflation.” The June dot plot showed 9 of 18 officials penciled in at least one 2026 hike, lifting the median year-end rate to 3.8% from 3.4% in March. That base rate framework means the current 3.50%-3.75% range could compress further before year-end. Pre-meeting positioning had been unusually elevated. August federal funds futures contracts reached a record 967,136 contracts — traders across positioning venues were making some of the largest bets on a Fed decision in years. CME FedWatch had pricing hold probability at 60-70% while hike odds sat at 30-40%, though prediction markets Polymarket and Kalshi had held probability in the 82-93% range. Citadel Securities was the notable contrarian, publicly betting on a surprise 25 basis point hike. The Bitcoin Price Reaction: Weakness Not Panic The Bitcoin price traded near $64,397 during Wednesday’s Asian session, reclaiming $64,000 in the hours before the FOMC announcement. Post-decision, weakness set in gradually rather than sharply. Per CoinStats data, spot sat at $63,929 late in the trading day — up 0.28% on the 24-hour, holding near the upper end of the $63,646-$64,533 range. Options positioning had already priced in a hold. Downside skew on Bitcoin options eased from 13% to 9% in the days before the decision — meaning traders reduced their protection against downside moves. Per pre-Fed analysis, options signaled potential upside toward $72,000 if bulls held key resistance at $64,450. Support ladder: $63,646 (immediate defense), $62,700 (July range low), $60,000 psychological, $58,115 (June 21-month low), $55,000 (whale accumulation zone from earlier July). Resistance ladder: $64,450 (immediate — options-implied resistance), $65,192 (200-day MA), $65,631 (50-month EMA), $66,850 (July 21 high), $70,173 (100-day SMA), $72,000 (options-implied upside target). The Fear & Greed Index sits at 28 (Fear) per CoinStats, unchanged through the Fed decision — reflecting cautious rather than panicked positioning. The 15% rebound from July lows earlier in the month has stalled but not reversed. ETF Flows: The Streak Break Matters Spot Bitcoin ETFs saw a $225 million outflow on July 23, breaking a seven-session, $999 million inflow streak that had lifted total spot BTC ETF assets to $79.16B by July 21. Per Paybis co-founder Konstantins Vasilenko: “July has delivered three straight weeks of net inflows after June’s record $4.5 billion outflow month — institutional demand is repairing, not charging.” The measured framing matters. Repair is not recovery. The 2026 net flow figure sits approximately $4.5 billion in the red, meaning institutional capital that fled the spot Bitcoin ETF complex during May-June has not been fully replaced by the July inflows. The Bitcoin price bounce over the past three weeks came from selling exhaustion combined with modest capital redeployment rather than fresh institutional demand at scale. The streak break on July 23 aligns with pre-Fed positioning. Institutions reducing exposure ahead of a rate decision they cannot handicap perfectly is normal risk management. Whether the outflow was a one-off tied to the Fed calendar or the start of a fresh downtrend determines the sustainability of the July recovery in Bitcoin price levels. What Warsh’s Communication Style Signals Chair Warsh has explicitly signaled he wants markets to lean less on Fed forward guidance. Per CoinDesk coverage, “Warsh has stressed changing the way the Fed communicates, even dedicating one of five task forces he has created to address the issue.” The terse 130-word July statement is the second data point confirming this. Per Vasilenko: “Investors have read the omission as fence-sitting, though it fits a Chair who would prefer markets stopped leaning so heavily on forward guidance.” The strategic implication for the Bitcoin price: less clarity on the Fed’s path means higher realized volatility around each FOMC decision, since markets will have less information to trade on between meetings. Post-meeting, Warsh confirmed press conferences will continue in 2026 — a partial concession to market expectations. But the direction of travel is
Best Crypto to Buy in Bear Market 2026: Check the Data First

Discover the 7 best cryptos to buy in a bear market with data-driven price targets and accumulation strategies. Learn what to buy, when, and how to manage risk.
Ethereum Slips to $1,874 as ETH ETFs Break 5-Day Streak

Discover the 7 best cryptos to buy before the 2028 Bitcoin halving. Data-backed picks from BTC to high-upside altcoins, plus allocation strategy and risks.
Michael Saylor Ethereum 2026: 3 Claims Tested and 1 Strong Rebound

Michael Saylor says ETH confidence has collapsed. We examine his bearish thesis, the $1,069 support level, and what the data actually shows for Ethereum in June 2026.
What Are the Best Crypto to Buy in 2026? A Data-Driven Guide

Discover what are the best crypto to buy in 2026 with a data-driven framework. Go beyond top 10 lists to build a portfolio with Bitcoin, Ethereum, and hidden gems.
Stablecoin Usage Surges as Traders Seek Lower-Risk Crypto Exposure in 2026

The stablecoin market crossed $320.6 billion in total supply by May 2026 — up from approximately $251 billion in late 2025, marking one of the fastest expansions of any major financial instrument in recent memory. As crypto volatility persists and traders seek lower-risk exposure to digital assets, stablecoins have moved from niche trading tool to core infrastructure of the entire crypto ecosystem. The honest analyst read: stablecoin usage is surging because the asset class now serves four distinct functions simultaneously — volatility hedge, trading rails, DeFi collateral layer, and emerging payments infrastructure — and the GENIUS Act enacted in 2026 has reshaped the regulatory landscape in ways that favor continued institutional adoption. This article unpacks what’s actually driving the surge, which specific stablecoins matter and why, what the GENIUS Act means in practice, and what the trajectory implies for both retail traders and institutional participants. By contrast to typical “stablecoins are growing” coverage that names no specific issuers or numbers, this is the data-anchored analysis of where the stablecoin market sits in 2026. The growth story is real; the structural drivers are documented; the regulatory inflection point is concrete. What the Numbers Actually Show in 2026 Context first, because precise data matters in a market segment this large. The stablecoin sector’s total market capitalization sits at approximately $320.6 billion as of May 2026 — a $50+ billion expansion since the start of 2026 alone. By Q1 2026, stablecoins accounted for 75% of total crypto trading volume. The asset class now serves 232 million+ stablecoin holders globally per RWA.xyz data — a population larger than that of most major countries. Transaction volume tells an even more striking story. Stablecoins processed approximately $46 trillion in transaction volume in 2025 — more than 20 times PayPal’s annual volume and approaching three times the volume processed by Visa. That’s not a trading-tool statistic; it’s payment-infrastructure scale. Olivia Sterling, Senior Crypto Analyst at Crypto Like This, framed the magnitude honestly: “The stablecoin market moved past ‘crypto sidebar’ a long time ago. At $320 billion in supply, $46 trillion in annual transaction volume, and 232 million holders, this is now financial infrastructure operating at sovereign-debt scale. The interesting analytical question isn’t whether stablecoin usage is surging — that’s settled. The interesting questions are which specific issuers will define the next phase, how the GENIUS Act reshapes who can compete, and what it means for traders looking to position around dollar-pegged exposure in 2026 and beyond.” The Named Issuers That Actually Matter Generic stablecoin coverage names no specific issuers. The honest framework requires identifying who actually controls the market and why each issuer matters differently. Tether (USDT) — $185.46B market cap, 57.96% market dominance (April 2026). Still the largest stablecoin by a wide margin. USDT’s strength is liquidity depth — it’s the default base trading pair on most exchanges globally, particularly in emerging markets. By contrast, USDT has historically faced the most regulatory scrutiny around reserve transparency. The GENIUS Act’s audit requirements will affect Tether disproportionately given its existing reserve composition. USD Coin (USDC) — ~$77-78B circulating, ~24% market share. Issued by Circle, USDC has positioned as the regulated alternative — attested by Deloitte, regulated across 20+ chains, and the dominant stablecoin on Solana (just over 50% share), Base (~90% share), and increasingly on Ethereum. Furthermore, USDC’s reserve transparency and compliance positioning give it structural advantages under the GENIUS Act framework. Ethena USDe — ~$5.9-13B (varies by reporting period). A newer entrant using delta-hedging strategies with crypto collateral rather than traditional fiat backing. USDe represents the “synthetic dollar” model that competes alongside traditional fiat-backed designs. By contrast, USDe’s mechanism carries different risks than traditional stablecoins — its peg depends on market conditions in derivatives, not on bank reserves. DAI — ~$5.4B. The largest decentralized stablecoin, backed by overcollateralized crypto assets via MakerDAO. DAI matters because it represents the decentralized model — no central issuer, no fiat reserves, no GENIUS Act applicability in the same way. As a result, DAI occupies a different regulatory and risk category than USDT/USDC. World Liberty Financial USD (USD1) — $4.6B. Has emerged as a top-5 stablecoin in 2026 — relatively new but with meaningful traction. Ripple’s RLUSD — ~$1.3B circulation. Launched December 2024, RLUSD represents Ripple’s institutional payment positioning. Backed by Ripple Prime infrastructure ($1.25 billion Hidden Road acquisition handling $3 trillion+ annual clearing volume). By contrast to consumer-facing stablecoins, RLUSD is positioned specifically for institutional cross-border settlement. The honest concentration picture: USDT and USDC together control over 80% of the entire stablecoin market. As a result, most stablecoin discussion is really USDT-vs-USDC discussion with everything else fighting for the remaining ~15-20% share. Why Stablecoin Usage Is Actually Surging The “lower-risk crypto exposure” framing is real but incomplete. The honest read on what’s driving the surge requires identifying four distinct functions stablecoins now serve simultaneously. Function 1: Volatility hedge within crypto. Traders moving funds into USDT/USDC during market weakness rather than back to fiat preserve crypto-market positioning while reducing volatility exposure. This is the original use case and remains a major driver — spikes in stablecoin balances on exchanges historically coincide with crypto market stress periods. As a result, stablecoins function as the crypto market’s internal “cash” position. Function 2: Trading infrastructure rails. Stablecoins are the default base trading pair on most exchanges globally. Q1 2026 stablecoin trading represented 75% of total crypto volume. This isn’t optional infrastructure; it’s the rails on which the entire trading ecosystem operates. Furthermore, the efficiency advantage over fiat conversion (lower fees, faster settlement, 24/7 availability) makes the rails durably attractive even when volatility eases. Function 3: DeFi collateral layer. Lending protocols (Aave, Compound, Kamino on Solana), perpetual exchanges, yield aggregators, and structured products all rely on stablecoins as the core collateral asset. Total stablecoin supply locked across DeFi protocols runs in the tens of billions. By contrast to volatile crypto collateral, stablecoin collateral provides predictable risk modeling — essential for institutional DeFi participation. Function 4: Emerging payments infrastructure. The $46 trillion in 2025 transaction volume
$58B Into Bitcoin ETFs Despite the 2026 Crypto Volatility
Bitcoin is down roughly 11% year-to-date in 2026, trading around $68,000 after a peak above $120,000 last cycle. Headlines focus on the volatility. The flow data tells a different story. Spot Bitcoin ETFs have absorbed $58.72 billion in cumulative net inflows since their January 2024 launch, including $12.4 billion in Q1 2026 alone and a further $2.44 billion in April, per data from Investing.com and Intellectia AI. That gap — loud short-term volatility, quiet structural accumulation — is the single most important dynamic in the crypto market right now. For traders and long-term investors trying to make sense of 2026, the question is not whether crypto is volatile. It always has been. The question is whether the institutional flows, the regulatory wins, and the on-chain accumulation patterns are durable enough to outlast the next correction. Here is what the data actually shows. Why the Headline Volatility Is Real Bitcoin moved from $120,000+ in late 2025 to roughly $68,000 by April 2026 — a peak-to-trough decline of more than 40%. That is genuine volatility, not a statistical artifact. The Iran conflict, elevated oil prices above $111, and macro risk-off pressure all contributed. ETF flow patterns reflect the stress, too: in May 2026, spot Bitcoin ETFs saw $1.26 billion in outflows over six consecutive trading days, with BlackRock’s IBIT alone shedding $448 million in a single session. That was the third-largest outflow streak of 2026. Altcoins took it worse. Q1 2026 ETP flow data showed altcoin ETFs sliding into outflow territory while Bitcoin held the institutional bid. Liquidity drained across mid-caps, orderbook depth on SOL fell roughly 7.4% versus its 7-day average per Amberdata research from January 2026, and the dispersion between BTC and the rest of the market widened sharply. By contrast, that is the normal pattern in a risk-off phase — and it is part of what makes “the crypto market is up” a misleading shorthand even in genuinely strong years. The Institutional Flow Story Behind the Volatility Underneath the price action, the institutional structure of the market has changed materially in 18 months. Three data points capture it. Cumulative ETF inflows have crossed $58.72 billion since the January 2024 launch. Q1 2026 added $18.7 billion in net crypto ETP inflows globally, with Bitcoin ETFs absorbing roughly $12.4 billion of that. If 2026 holds the Q1 pace, the year will outpace both 2024 ($48.7B) and 2025 ($47.2B) — and absorb more than four times the Bitcoin issuance from new mining. BlackRock’s IBIT now holds 773,000+ BTC — more than 3.6% of the total Bitcoin supply that will ever exist. Bank of America has built a $37 million position. Trump Media has allocated $2.5 billion to Bitcoin treasury. These are not retail flows. They are slow, deliberate balance-sheet decisions made by entities that move quarterly, not daily. Stablecoin supply now sits near $270 billion, per Amberdata. Grayscale projected the total could reach $300 billion by year-end 2026 under the new GENIUS Act framework. Stablecoin growth is one of the cleanest leading indicators of real on-chain activity, because dollar-pegged tokens are used for payments and settlement, not pure speculation. By contrast, the May 2026 ETF outflow reversal does matter. The $1.26 billion six-day exodus shows institutional capital is not “patient money” in the way some narratives suggest. Large allocators rotate when macro conditions shift. However, the bigger arithmetic still favors structural demand: $58.72 billion in cumulative inflows means even a violent month of outflows barely dents the underlying base. Regulation Has Moved From Threat to Tailwind The 2024-2026 regulatory shift is the most underappreciated structural change in the entire market. Three milestones matter. The GENIUS Act was signed into law on July 18, 2025, establishing the first federal framework for US payment stablecoins. Issuers now back stablecoins with 1:1 reserves of cash or short-term Treasurys, disclose reserves monthly, and operate under a bank-like regulatory regime with AML compliance built in. Treasury rulemaking under the act is due July 18, 2026. The CLARITY Act — which defines whether digital tokens fall under SEC or CFTC oversight — advanced through the Senate Banking Committee by a 15-9 vote on May 14, 2026, after a White House-Senate compromise on stablecoin yield provisions. Analyst odds of passage this year now sit around 70%. The SEC has changed posture entirely. Former chair Gary Gensler resigned in January 2025. Paul Atkins took over and has pushed rules-based oversight rather than enforcement-driven actions. The IRS modernized crypto tax reporting with Form 1099-DA. Trump’s Executive Order 14178 created a federal “Crypto Czar” role to coordinate policy across agencies. None of this guarantees friendly outcomes on every issue, but the climate has flipped from “regulation by enforcement” to “regulation by rulemaking” — which is what large allocators were waiting for. What On-Chain Data Tells Us About 2026 On-chain signals confirm what the ETF flow numbers suggest. Bitcoin exchange balances are sitting near 2019 lows — meaning long-term holders are pulling supply off exchanges and into self-custody, the classic accumulation pattern that precedes major moves up. RSI on Bitcoin recovered from oversold readings near 30 back to 52 during the spring 2026 correction. That is a textbook reset, not a capitulation. The other notable signal is the divergence between institutional ETF demand and miner-driven supply. If 2026 ETF inflows hold their Q1 pace, demand will dramatically exceed new BTC issuance from mining. This is the first cycle in Bitcoin’s history where structural buyers — not halvings — are setting the long-term floor. Ethereum tells its own story. ETH traded around $2,150 in March 2026 after BitMine disclosed a $6.6 billion ETH treasury position, signaling long-term institutional accumulation. By contrast, some analysts — including Benjamin Cowen — argue Ethereum may not reach new all-time highs in 2026, citing liquidity conditions and Bitcoin’s current market structure. The dispersion in ETH forecasts is wider than BTC right now, which makes it both the higher-conviction laggard and the higher-risk bet. What This Means for the Next Six Months Three things to watch through the second
Crypto’s Real-World Utility 2026: $28T in Stablecoin Flows

Stablecoins moved roughly $28 trillion in real economic volume in 2025, per Chainalysis — more than Visa and Mastercard processed combined that year. BlackRock’s tokenized money market fund BUIDL now holds $2.85 billion in assets, with the world’s largest asset manager committing $150 billion to digital markets and saying tokenization is “where the internet was in 1996.” Mastercard agreed to acquire stablecoin infrastructure firm BVNK for $1.8 billion in March 2026 — its largest crypto deal on record. The “real-world utility” pitch that has dominated crypto narratives for a decade is finally backed by numbers that match. This is the inflection point. After years of vague promises about supply chains and identity, the data now shows blockchain rails handling institutional money market funds, cross-border B2B payments, retail card spending, and Treasury-backed reserves at trillion-dollar scale. Here is who is moving, where the numbers are, and what could still derail the trend. What Is Actually Happening Three categories of real-world utility have crossed from theoretical to operational in the past 18 months: stablecoin payments, tokenized financial assets, and high-throughput blockchain infrastructure capable of carrying both. Stablecoin payments became settlement infrastructure. Chainalysis recorded $28 trillion in adjusted stablecoin transaction volume in 2025. B2B stablecoin payments alone hit $226 billion, up 733% year-over-year per Spark research. Crypto card spending — stablecoin-funded purchases at regular Mastercard and Visa merchants — grew roughly 15x from $100 million per month in early 2023 to $1.5 billion per month by late 2025, implying an annualized run rate near $18 billion. By contrast, this is not consumers asking Starbucks to accept Bitcoin. It is dollar-pegged tokens quietly absorbing the rails that move real commerce. Tokenization moved up the asset stack. BlackRock’s BUIDL launched in 2024 on Ethereum, has since expanded to Solana and Avalanche, and now sits at $2.85 billion in AUM. Carlos Domingo of Securitize estimated the total tokenized asset sector at roughly $30 billion at ETHConf in May 2026. In May 2026, BlackRock filed paperwork for two additional tokenized money market vehicles — including a digital share class tied to its $6.1 billion BlackRock Select Treasury Liquidity Fund (BSTBL) and a new fund called BRSRV designed for investors who manage cash through crypto wallets rather than bank accounts. High-throughput infrastructure shipped. Solana’s Firedancer validator client went live on mainnet in December 2025 after three years of development by Jump Crypto. By Q2 2026 it was running on more than 20% of active validators and had produced over 50,000 blocks. The hybrid Frankendancer implementation demonstrated 600,000+ transactions per second in live testing. Real-world sustained TPS sits around 3,000-5,000 at roughly $0.00025 per transaction — already enough for payments-scale applications. Ethereum’s Pectra upgrade reduced Layer 2 fees by roughly 40% to $0.10-$0.50, and PeerDAS (activated December 8, 2025) is expected to drop L2 fees another 50-70% through 2026. Why Now Three forces converged at once. First, regulation. The GENIUS Act was signed into law on July 18, 2025, creating the first US federal framework for payment stablecoins. Issuers now back tokens 1:1 with cash or short-term Treasurys and disclose reserves monthly. Stablecoin issuers collectively hold roughly $155 billion in US Treasury bills as of October 2025, making them one of the largest single holders of US government debt. The CLARITY Act, which defines SEC vs CFTC jurisdiction over digital assets, advanced through the Senate Banking Committee by a 15-9 vote on May 14, 2026. Second, infrastructure consolidation. Stripe acquired stablecoin orchestration startup Bridge for $1.1 billion in October 2024. Stripe’s 2025 annual letter reported stablecoin payments volume doubled to around $400 billion, with Bridge volume more than quadrupling. Mastercard followed in March 2026 with the $1.8 billion BVNK acquisition. Visa launched USDC settlement in the US in December 2025 and was running a $4.6 billion annualized settlement volume across 130+ stablecoin-linked card programs in 50+ countries by March 2026. Stripe’s Bridge unit and Visa are launching joint stablecoin-linked cards in 100+ countries through 2026. Third, institutional conviction. BlackRock manages $14 trillion and now controls roughly $68 billion in direct crypto exposure — including 577,919 BTC inside IBIT and 1.298 million ETH. Larry Fink’s 2026 annual letter framed tokenization as “the mechanism for updating the plumbing of the global financial system.” When the world’s largest asset manager describes a market that way, the question shifts from “will institutions arrive” to “how much faster can they move.” Who Is Moving The map of real builders is clearer than at any prior point in the cycle. In payments: Visa, Mastercard, Stripe, and PayPal are the incumbents that committed real capital. Stripe alone processed $1.9 trillion in payment volume in 2025. Stablecoin issuers Tether ($187.81B USDT) and Circle ($76B USDC) provide the underlying tokens. Klarna launched KlarnaUSD on Stripe’s Tempo blockchain, citing the $120 billion in annual global cross-border payment fees as motivation. Cash App added native USDC and USDT support in March 2025. In tokenization: BlackRock leads on AUM, with Franklin Templeton, Fidelity, Apollo, and Securitize all running their own tokenized fund products. Coinbase and Apex Group partnered on a tokenized Bitcoin yield fund. Nasdaq partnered with Talos to test tokenized collateral. Banks including JPMorgan and Standard Chartered are running tokenized deposit pilots, with Standard Chartered’s recent launch in Hong Kong cited as a regulatory test case. In scalable infrastructure: Ethereum and Solana remain the dominant venues, with Ethereum’s mainnet plus L2 ecosystem holding $85.3 billion in TVL (Base $5.15B, Arbitrum $3.17B) versus Solana at ~$8-9 billion. Ethereum counts 31,869 active developers per Coinlaw, against Solana’s 17,708. Hyperliquid, covered as a major airdrop story in late 2024, is now generating $1-1.3 billion in annualized protocol revenue per DeFiLlama and Token Terminal, with eleven employees — a per-employee efficiency level that exceeds elite Wall Street trading firms. What Could Break the Trend The trend is real, but it is not inevitable. Four risks deserve naming. Regulatory backsliding. The GENIUS Act and the CLARITY Act both still need final rulemaking through July 18, 2026 and beyond. A change in administration, a high-profile
